· 5 min read
When Synthetic Data Stops Improving and Starts Memorising
MSc Computer Science, University of Birmingham. Supervised by Per Kristian Lehre.
Download the Full Dissertation (PDF)The project started from a common problem. Labelled data was often scarce, sensitive or hard to share, and one workaround was to train a generative model on the real data and use its output instead. The catch was that a generator trained for long enough began to reproduce its training examples, which defeated the point of using synthetic data in the first place.
My dissertation asked a practical question. If the synthetic images were going to train a classifier, how long should the generator have been trained? Was there a point where the images were already as useful as they would get, before the model started copying?
The Setup
I trained conditional diffusion models on subsets of MNIST ranging from 200 to 10,000 images, and checked each one at up to fifteen points between 250 and 64,000 training steps. At every checkpoint I did two things with the same generator:
- Usefulness. I generated 5,000 images, trained a classifier on those alone, and tested it on real images it had never seen.
- Copying. I compared each generated image with the exact images the generator was trained on, and counted it as a copy if it sat much closer to one training image than to any other.
Measuring both at the same checkpoints was the core of the method. It meant the two events could be placed on the same timeline.
Require: training subset , generator seed , checkpoints , samples per checkpoint
- Train generator on , saving its parameters at every
- for each checkpoint do
- Generate a class-balanced synthetic set of images
- Compute memorisation and coverage against
- for each classifier architecture do
- Train classifier from scratch on only
- Evaluate on the real test set
- Record its test accuracy as the downstream accuracy
- end for
- end for
I kept training and evaluation separate. Checkpoints and generated sets were saved to disk, so evaluation could be rerun or extended without retraining a generator that had taken hours to train.
The Maths
How the Diffusion Model Learned. Each real image was mixed with Gaussian noise according to a schedule , giving a noisier version . At large it was almost pure noise.
A neural network was trained to look at the noisy image, the timestep and the class label , and predict exactly which noise had been added. Generating a new image meant starting from noise and running that prediction in reverse.
How Copying Was Detected. For each generated image , I measured its distance to every training image and took the two closest, and . A genuinely new image sat at a similar distance from several training images. A copy sat right on top of one of them.
Using a ratio rather than a raw distance mattered. Larger training sets were denser, so every distance shrank. The ratio adjusted for that, which kept results comparable across training-set sizes. The memorised fraction at checkpoint was the share of the samples flagged as copies.
The Two Events. The accuracy plateau was the first checkpoint to reach 95% of the best accuracy observed. Memorisation onset was the first checkpoint where at least 5% of samples were copies.
How Onset Scaled. I modelled the onset step as a power law in training-set size . Because checkpoints were discrete, each observed onset only showed that it happened somewhere between two checkpoints, and runs that never copied gave a lower bound. So instead of fitting a line, I kept every consistent with all of those intervals at once.
The values of that survived lay between 1.21 and 1.32. Put simply, doubling the training data delayed the start of copying by roughly 2.3 to 2.5 times.
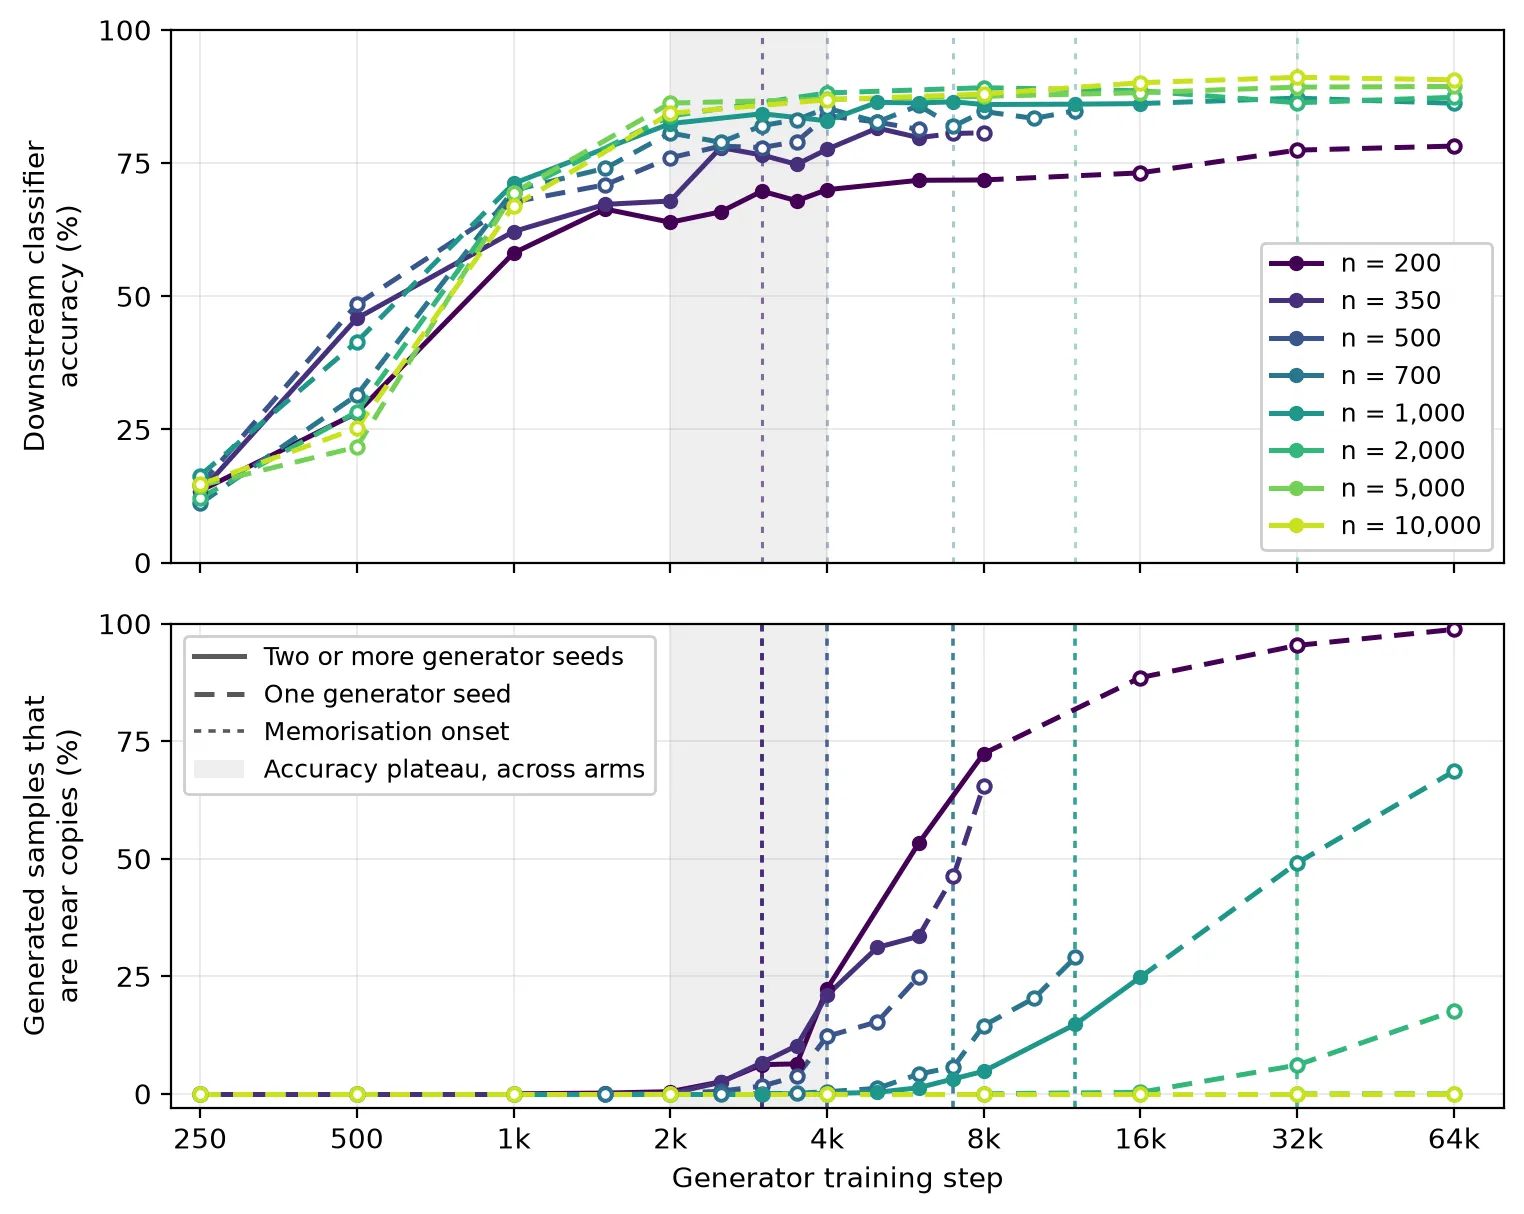 Classifier accuracy (top) and share of generated images that were near copies (bottom). The grey band marks where accuracy levelled off; dotted lines mark the start of copying.
What I Found
Accuracy Levelled Off Early. For every training-set size, accuracy from synthetic data reached 95% of its best level between roughly 2,000 and 4,000 steps. Training for up to sixteen times longer moved it by only one to three percentage points.
Synthetic Data Came Close to Real Data. At that plateau, classifiers trained on synthetic images reached 93.1% to 98.5% of the accuracy of classifiers trained on the real images, even though the synthetic set was often many times larger.
Copying Started Later, and Later Still With More Data. From 700 training images upwards, accuracy plateaued before copying began. The plateau stayed at about the same step whatever the training-set size, while the start of copying moved later as the training set grew. So the safe window between the two widened with more data.
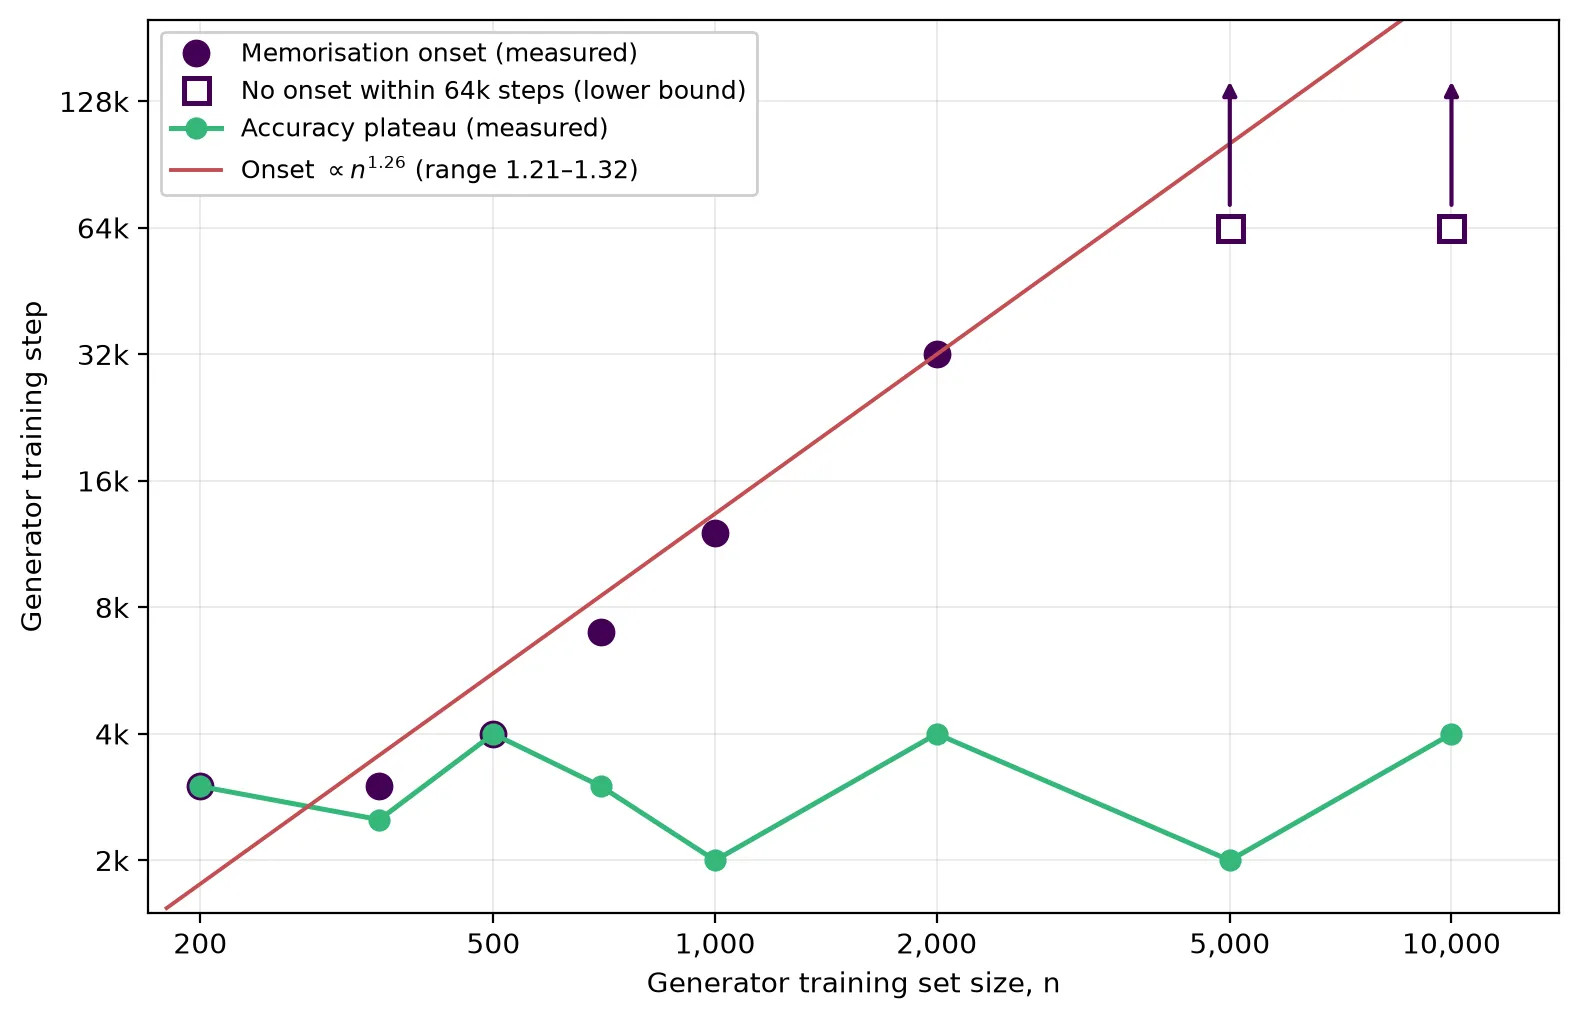 When the accuracy plateau and the start of copying happened, by training-set size. The two largest sets never started copying within 64,000 steps.
The Model’s Own Metrics Did Not Show Either Point. Validation loss kept falling smoothly through both events, so watching the generator alone would not have shown when to stop. The answer came from measuring the downstream outcome directly.
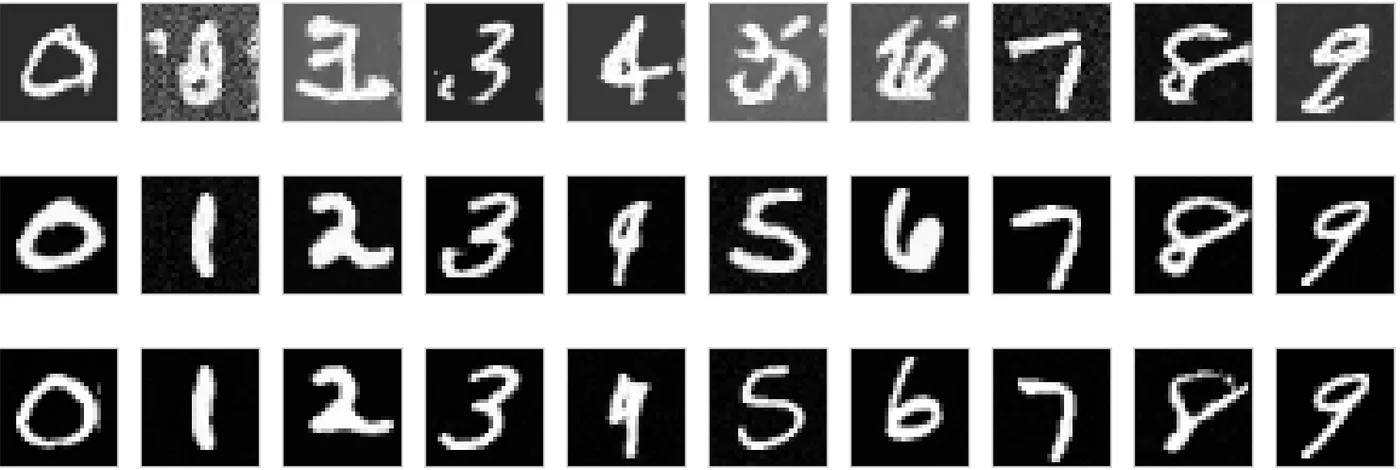
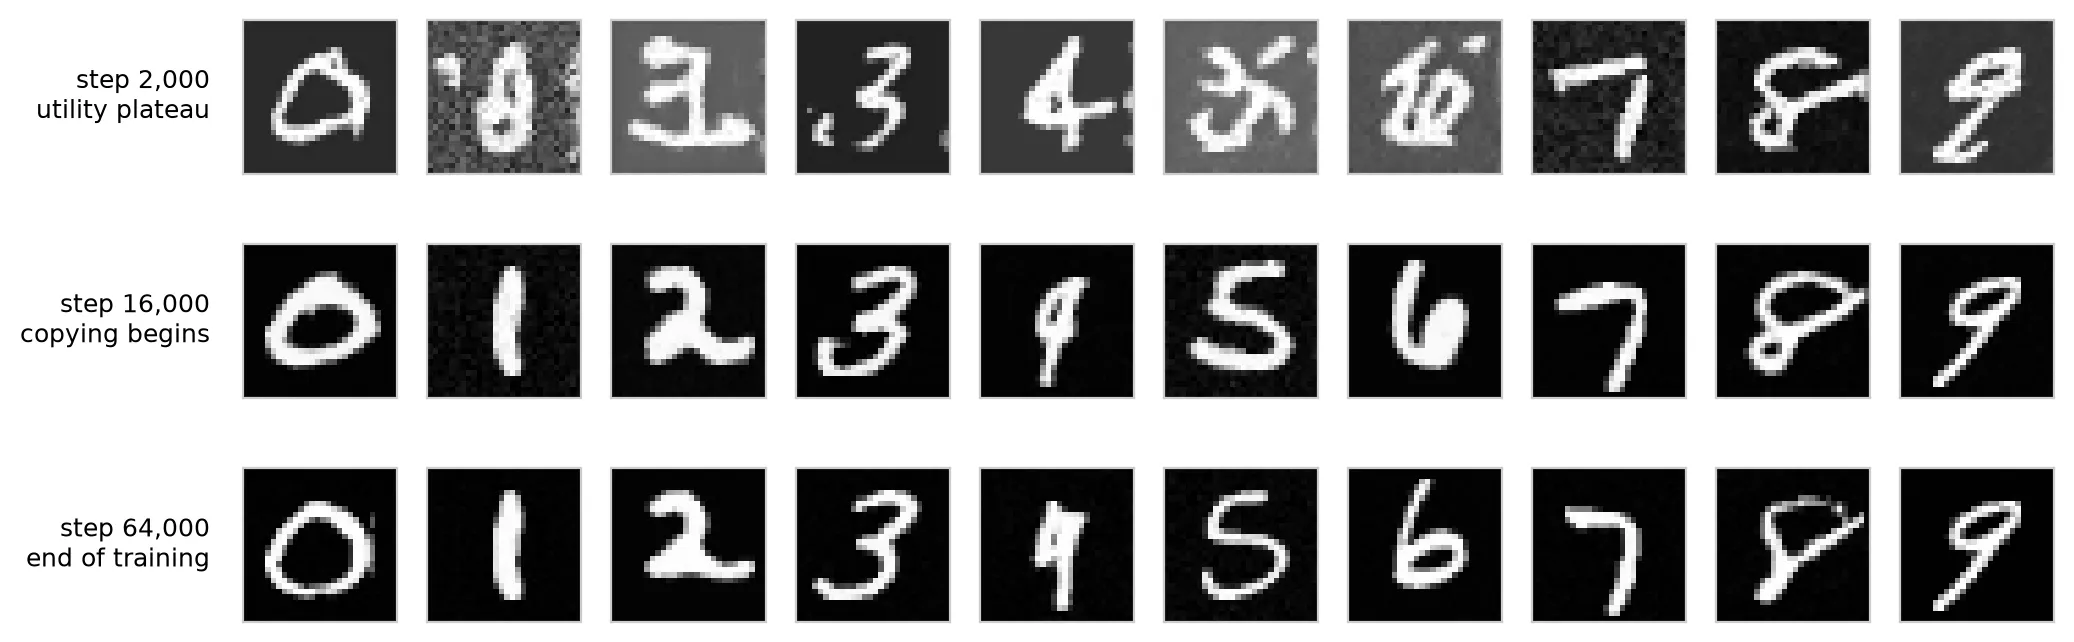 Samples from the same generator at 2,000, 16,000 and 64,000 steps. The noisy first row already supported a classifier within 95% of its best accuracy.
Limits
These results came from one dataset at one resolution, one generator size, and training sets that were small by practical standards. Several arms ran with a single seed. I also tried to extend the method to CIFAR-10, which showed what model capacity and validation work would be needed before the same comparison could hold on more complex images.
The full dissertation covers the method, controls, statistics and limitations in detail.